
Savanna climate graph
Grasslands are defined by seasonality. A tropical rainforest and a savanna grassland are both hot all year, yet they receive very different amounts of rain, and the savanna gets almost all of its rain in one part of the year. A climate graph shows this at a glance. How to read one is set out in the lesson on rainforests.
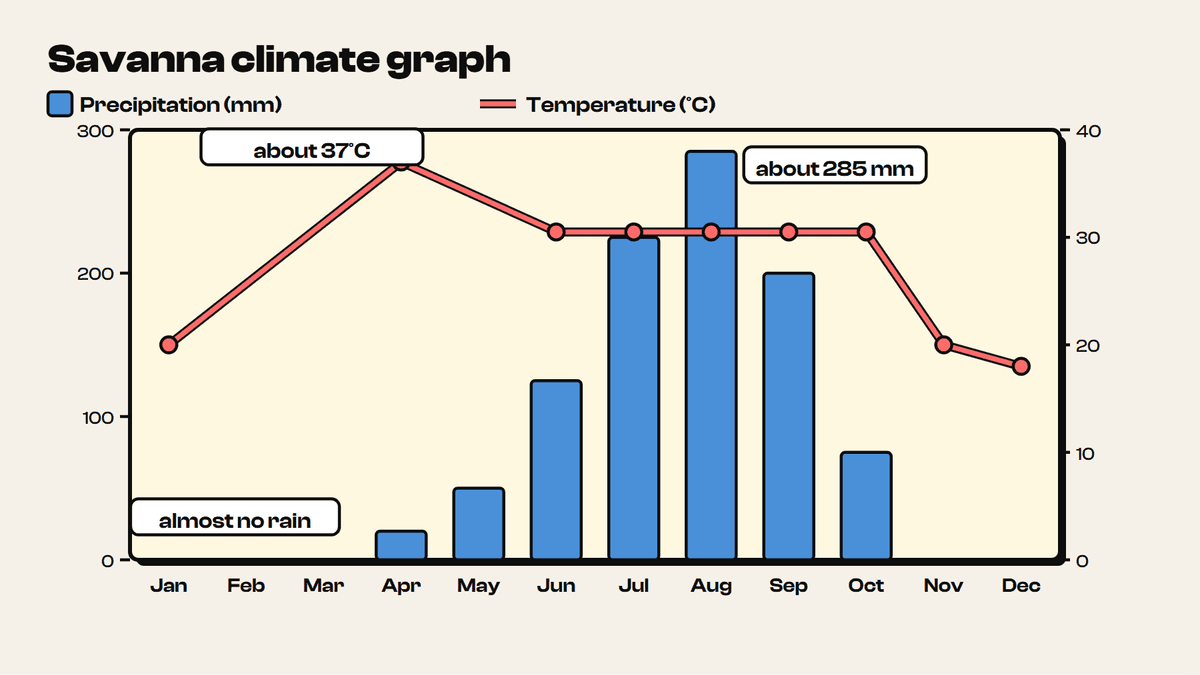
Figure 6.5 shows a savanna in the northern hemisphere. Reading it month by month:
- Dry season. From November to March there is almost no rain, and December gets none at all.
- Wet season. Rain starts in April (about 20 mm) and builds through May (about 50 mm), June (about 125 mm) and July (about 225 mm). It peaks in August at about 285 mm, then falls away through September (about 200 mm) and October (about 75 mm).
- Temperature. It is about 20°C in January and climbs to a peak of about 37°C in April. It holds at around 30–31°C from June to October, then drops to about 20°C in November and 18°C in December.
Adding the monthly bars gives an annual total of roughly 1,000 mm. The annual temperature range is about 19°C (37°C minus 18°C).
The hottest month, April, comes just before the heavy rain starts. Once the wet season arrives, temperatures settle a few degrees lower and stay fairly steady.
An equatorial climate (Figure 6.4), where tropical rainforest grows, looks very different. Near the equator temperature and precipitation are similar in every month, and annual rainfall reaches about 2,000 mm. Savanna grasslands lie to the north and south of the rainforests, and their climate has one clear wet season and a long dry season. Earth's tilt and the movement of the ITCZ explain why.
9 more sections in this topic
Pick this up in your Library: it holds the whole topic, notes, cheatsheet and questions.