
Equatorial climate graph
Climate is the average temperature and precipitation of a place, worked out from measurements taken over about 30 years. Weather changes from day to day. Climate is the long-run pattern, and it is the main reason a biome such as the tropical rainforest exists where it does.
The average temperature (°C) and precipitation (mm) of a place, measured over roughly 30 years.
A climate graph shows that yearly pattern on one chart.
- The x-axis shows the months of the year.
- Blue bars show precipitation for each month, read on the left y-axis in mm.
- A red line shows temperature, read on the right y-axis in °C.
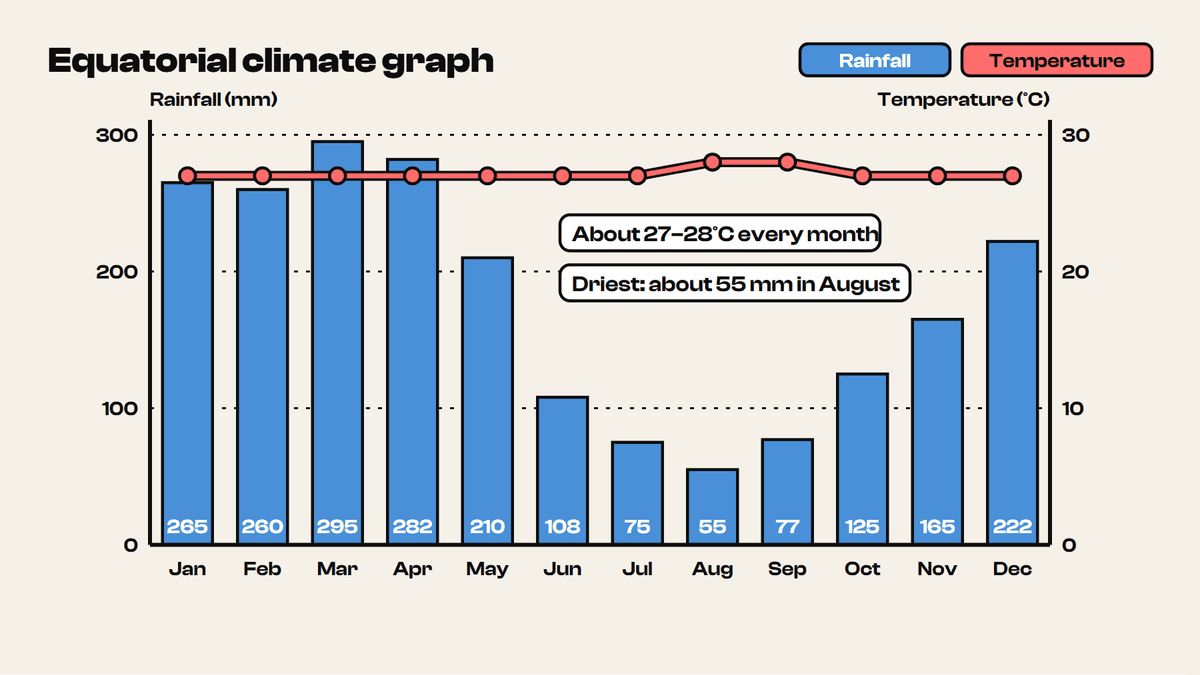
Reading Figure 6.4 month by month gives a clear picture of the equatorial climate.
- Temperature stays at about 27–28°C in every month, rising only slightly in August and September. The annual range is only about 1°C.
- Rainfall is heaviest from January to April and peaks at about 295 mm in March. It is lowest in August, at about 55 mm.
- Adding the twelve monthly bars gives an annual total of roughly 2,140 mm.
To find the total precipitation, add all twelve bars: 265 + 260 + 295 + 282 + 210 + 108 + 75 + 55 + 77 + 125 + 165 + 222 = 2,139 mm.
To find the annual average temperature, add the twelve monthly temperatures and divide by 12. For Figure 6.4 the answer is roughly 27–28°C.
Even the driest month still gets rain, and no month is cool. A plant growing here never meets a cold or fully dry season, so it can grow all year. The rest of the rainforest system, from its soil to its people, follows from this.
Many students describe a climate graph only as "hot and wet". Always quote figures with units, for example "rainfall peaks at about 295 mm in March" or "temperature varies by only about 1°C".
9 more sections in this topic
Pick this up in your Library: it holds the whole topic, notes, cheatsheet and questions.