
Natural resources
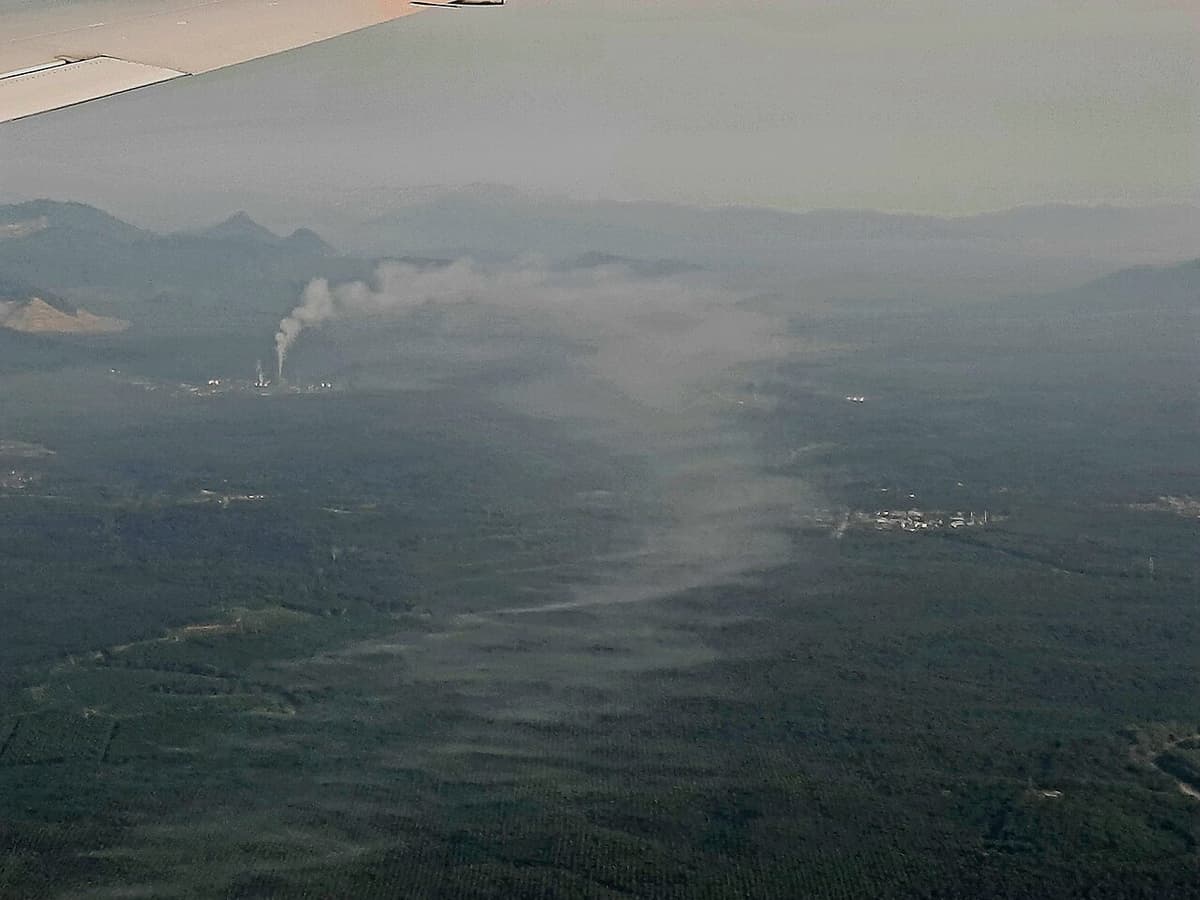
One photograph of the palm oil industry in Malaysia holds the whole story of resources. The plantation stands on land that was once forest. The processing plant burns energy and sends smoke into the air. The oil is then sold to consumers. Each stage, from extraction to production to consumption, leaves a mark on the environment. Reducing those marks is one of the central problems of development.
All the naturally occurring materials on Earth that people can use to meet their needs, from water, air and food to the minerals industry uses to make goods.
Some resources, such as water and food, meet everyone's basic needs. Others, such as minerals, are used mainly by industry to manufacture industrial products and consumer goods. However varied they are, all resources fall into two groups.
A resource that can in theory be used again and again because nature replaces it, provided it is used no faster than it regenerates.
A finite resource that cannot renew at all, or renews so slowly that the process is meaningless on a human time-frame.
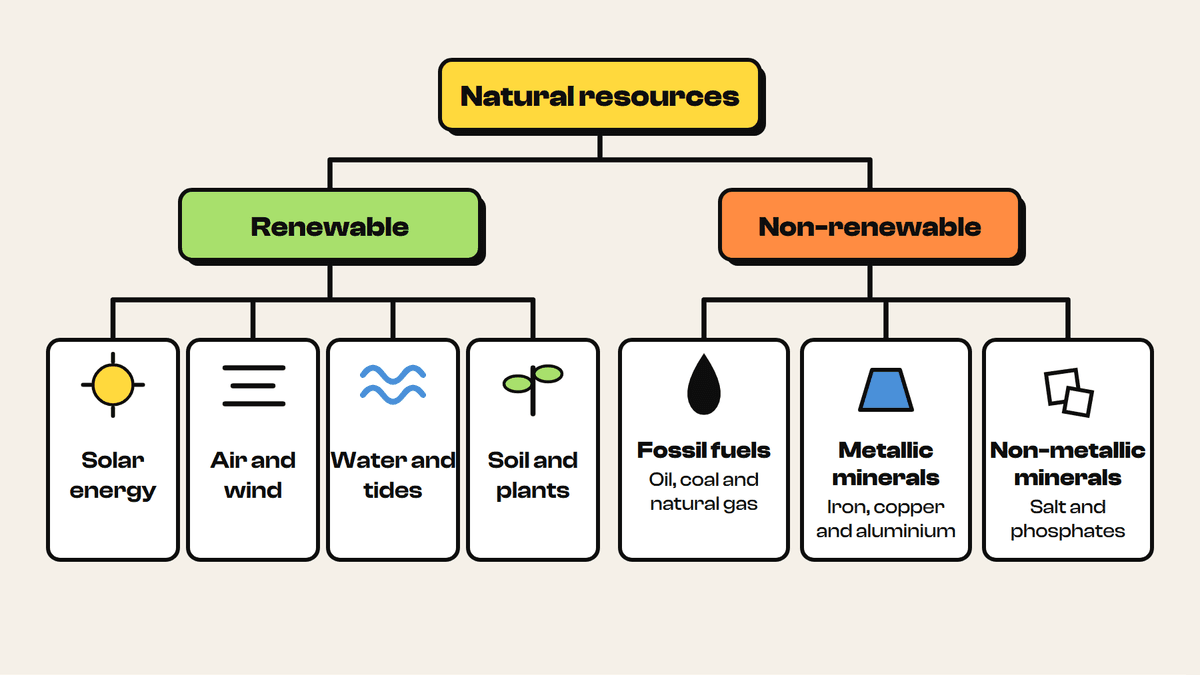
Biomass, the living part of the environment such as soil and plants, renews itself through a natural cycle. Plants take up nutrients from the soil. When they die and decompose, those nutrients return to the soil, which keeps regenerating so that new vegetation can grow. Farmers rely on the same cycle to grow crops year after year. Wild animal populations such as fish are renewable in the same way, but only while the fishing industry does not overexploit them.
Renewable does not mean unlimited. A fish stock, a forest or a soil stays renewable only while depletion is slower than regeneration. Overuse can exhaust it just as surely as a coal seam.
Non-renewable resources include metal ores and other earth minerals, and fossil fuels (petroleum, coal and natural gas). Large underground stores of water called aquifers also count as non-renewable to some extent, because they refill far more slowly than they can be pumped.
A group of metals, also called rare earth metals, that are fairly abundant in the Earth's crust but hard to extract, and finite.
Mining of REEs is increasing because they are essential to clean energy technology. They go into wind turbine motors, high-performance batteries, magnetic refrigeration and fuel cells, all of which help cut greenhouse gas emissions and dependence on fossil fuels. This creates a real tension. Moving towards a carbon-free world reduces the use of one finite resource by increasing the use of another.
Global patterns of production and consumption
The places that produce resources and the places that consume them are often different. Comparing the two patterns shows how much the world economy depends on flows of materials between regions.
The total quantity of raw materials (biomass, construction minerals, fossil fuels and metal ores) needed to make the goods used by a country's economy.
Totals and per person figures tell different stories. In total, China had by far the largest material footprint in 2008, about 16 gigatonnes. That was roughly double the USA (about 8) and well ahead of India (about 4.5) and Brazil (about 3). Per person, the ranking changes. Australia used about 35 tonnes per person, much of it metal ores, followed by Japan (about 29), the USA (about 27) and the UK (about 25). Chile reached about 23 tonnes, mostly metal ores. China dropped to about 12 tonnes and India was lowest at about 4. A large population pushes up the total, while wealth and a mining-based economy push up the figure per person.
The same contrast appears on world maps of individual resources.
- Oil (2012). Production is highest in the USA, Canada, Mexico, Russia, China and the Saudi Arabia and Iran region. Consumption is highest in the USA and China, with Canada, Russia, Brazil and India in the middle bands. Most of Africa produces and consumes little.
- Meat (2011). China produces the most meat, followed by the USA, with Brazil and Russia also high. Supply per person peaks in the USA, Australia, New Zealand and Argentina, is fairly high in Europe, Canada, Russia and Brazil, and is lowest in India and much of Africa.
- Fish (2011). China leads capture fisheries, with the USA, Peru, Indonesia and Russia also major producers. Consumption per person is highest in Japan, Iceland, Norway, Portugal and parts of Southeast Asia, and lowest in much of Africa, Brazil and Mexico.
- Water. Renewable freshwater per person (2012) is lowest in North Africa and the Middle East and highest in Greenland, with Canada, Russia, South America and Australia also well supplied. The largest agricultural water withdrawals (2010) are in the USA, India and China.
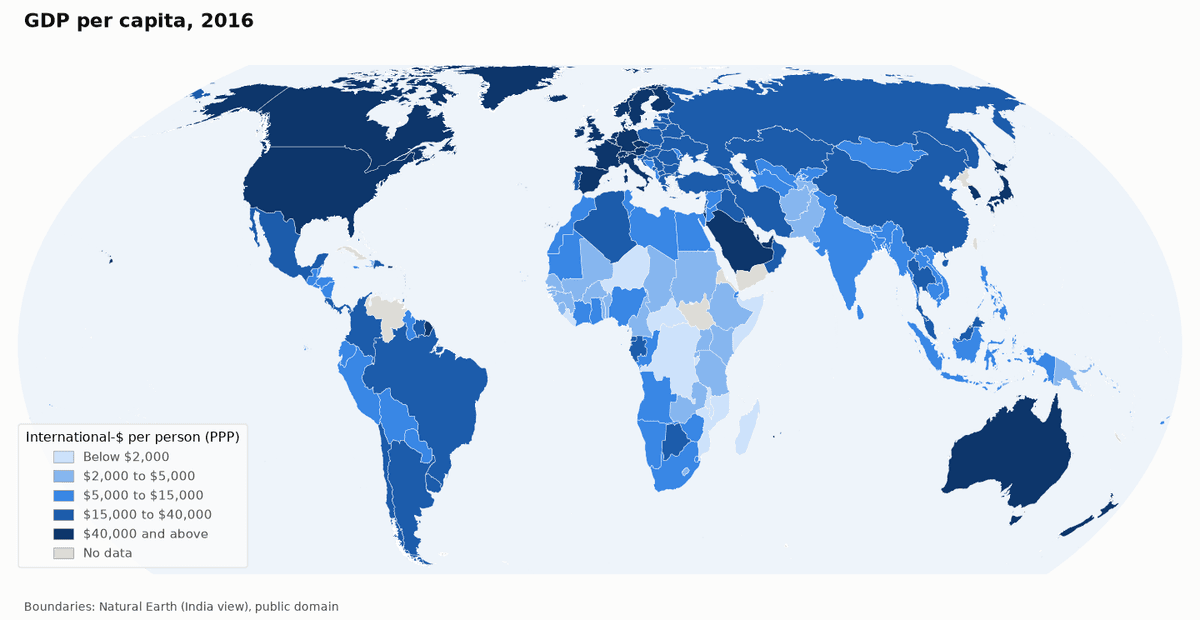
Place these resource maps beside the income map. The highest incomes are in North America, Western Europe, Australia and the Gulf states. These are also the regions with the highest consumption of meat and fish per person, such as Japan, Iceland and Norway for fish, and the USA, Australia and New Zealand for meat. Parts of Southeast Asia break the link, eating a lot of fish despite lower incomes. Much of Africa sits at the bottom of both the income map and the consumption maps. China and India stand out as giant producers and consumers in total, yet their material footprints per person are far below those of richer countries.
Describe a map pattern with TEA. State the Trend (the general pattern), give an Example with a named country and a value from the key, then point out an Anomaly that breaks the pattern.
TEA for meat supply per person. Trend: supply is highest in high-income regions and lowest in low-income regions.
Example: the USA, Australia and New Zealand fall in the top bands of the 0 to 160 kg key, while India and much of Africa fall in the lowest.
Anomaly: Argentina reaches the top band alongside the USA even though its income band is lower than Western Europe's.
9 more sections in this topic
Pick this up in your Library: it holds the whole topic, notes, cheatsheet and questions.