
The Demographic Transition Model
World population began to climb quickly in the early nineteenth century. By the start of the twentieth century the growth had become extremely rapid. Geographers want to explain which processes produced this surge, and one of the most widely used tools for doing so is the Demographic Transition Model.
A graph that shows how changes in birth rate and death rate over time affect the total population of a country.
The model is built from birth and death rates, which are defined in the lesson on components of population growth. What matters here is the gap between the two lines. When births are higher than deaths, the population grows through natural increase. When deaths are higher than births, it shrinks through natural decrease.
The DTM has two uses. It can trace how one country's population has changed over a long period of time. It can also be used to place present-day countries at different stages, so you can compare them.
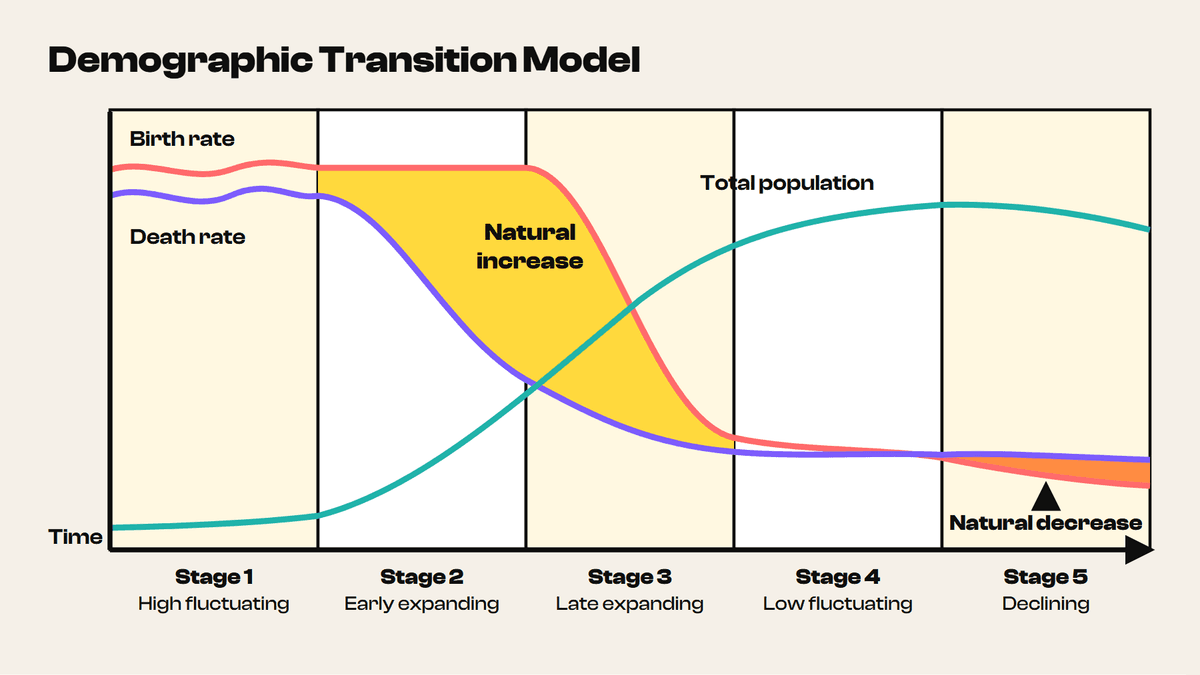
The x-axis of the general model shows time with no dates on it. Different countries pass through the stages in different centuries and at different speeds, so the model describes a sequence of change, not a timetable.
8 more sections in this topic
Pick this up in your Library: it holds the whole topic, notes, cheatsheet and questions.