
Maps as tools for spatial analysis
Maps are the geographer's main working tool. A single map holds information about place, space and time, and a lot of what it tells you has to be inferred by reading it carefully. Its greatest strength is that it shows how places connect to one another.
The connections that people and places have with each other because of where they are located.
When geographers analyse a map, they are usually trying to do one or more of these things:
- find patterns and the processes that produce them
- spot anomalies that break the pattern
- test a hypothesis or theory against located evidence
- produce new data and knowledge tied to specific places
Every map also has limits. A printed map, and to some degree a digital one, records a particular area at a particular moment. Most printed maps are already out of date by the time they are published, because the places they show have kept changing. Digital maps can be refreshed, but they are not all updated at the same rate, so one map may use recent data while another relies on figures that are years old.
Evaluate a map source before you interpret it. Check who produced it, when its data were collected, what area it covers and what it leaves out. A confident conclusion drawn from an outdated map is still a weak conclusion.
From hand-drawn maps to GIS
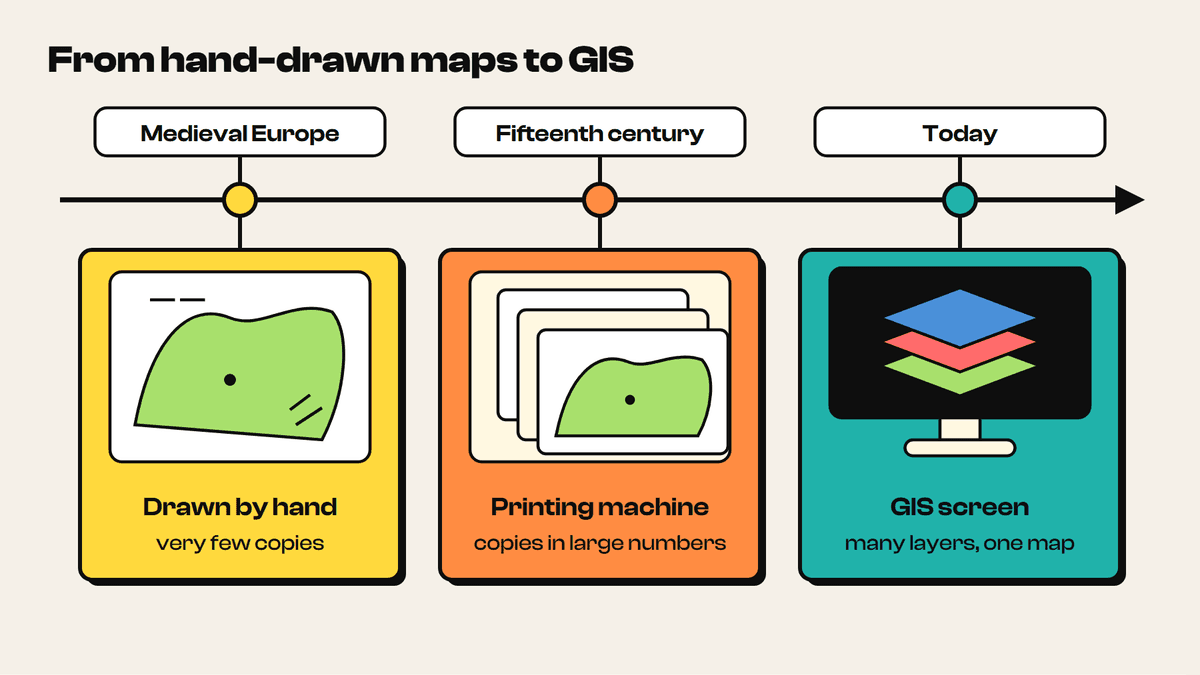
Map making has a long history. In medieval Europe maps were drawn by hand, so very few copies existed and most people never saw one. The arrival of the printing machine in the fifteenth century changed that. Maps could be reproduced in large numbers and became far more widely used.
Today digital maps are part of daily life. Most people use them on phones and computers to find locational information instantly. The same digital technology underpins Geographic Information Systems (GIS), which have changed the way geographical issues are investigated, analysed and critically evaluated.
Hand-drawn maps still have a place. A sketch map drawn with pencil and paper forces you to pull together the concepts and facts you have learnt about a specific place or case study. Because you built it yourself, you own the information and can use the sketch as supporting evidence in an investigation, report or essay. GIS adds what paper cannot: many datasets on one map, which you can switch on, off and restyle at will.
9 more sections in this topic
Pick this up in your Library: it holds the whole topic, notes, cheatsheet and questions.